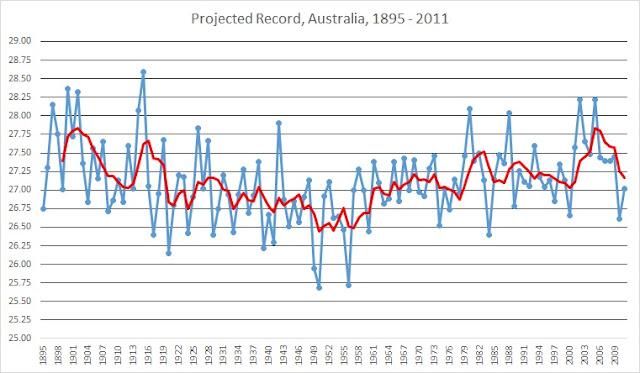
As I mentioned in a previous post, I found the data from the station located in Robe Australia to be unusable because of serious site contamination. Meaning what once was probably a rural area is now a business district. It is surrounded by concrete, buildings, AC units, and other objects which could influence the measurements. All of this is easily detectable in the data.
After reviewing each site and reviewing the data I rejected 7 out of 10 sites as unusable. Below are pictures of representative sites I rejected.
The following are from the town of Hobart.
These are pictures of the station located in Diniliquin
This station is located almost in a court yard at the edge of a large development. However, this is one of the sites which had an unusual cooling trend. One of the things which jump out at me are how shadows from nearby trees and buildings come close to the station location.
The next set of pictures is from Observatory Hill in Sydney.
This station is in a partial enclosed space, close to a brick wall and several electrical boxes. There are tall buildings nearby. The entire are is surrounded by development.
Now for some pictures of the sites I accepted.
This is the Cape Otway Light House. As you can see it is a rural area. The actual location is more in the grassy area, the GPS coordinates were off a bit. There is nothing blocking the wind, there are no structures close enough to affect the readings.
The next pictures are from the Richmond Post Office. As you can see the site is in an open field well away from any buildings.
The final set of pictures is from Boulia Airport. This station is located well away from any buildings and is certainly not sheltered from the wind. It is close to a runway. I would think any influence would be minimal.
These last three locations are as good as it gets. I see no reason to reject them. They are probably not in precisely the same location and there are probably other factors I am not seeing. However, I am also looking at the data. There are no abrupt changes of any kind. All three locations have extremely similar records. Speaking of which, let's get to that.
This is the average of those three stations with a running 5 year average trend line. All three stations follow this trend with an average maximum deviation of ± 0.32°. Most of that variance occurs from 1895 to 1900. From 1900 onward deviations from the average trend are minimal.
Below is a graph of the maximum and minimum deviations from average for all three stations used in my graph.
Do not mistake me here. This is not a reconstructed average of the record of temperature change in Australia. There simply isn't enough data to make a true reconstruction. This is the average record for three sites with minimal human induced localized changes. Because changes due to local factors have been minimized as much as possible this provides a better baseline as to changes in temperature due to changes affecting the entire region than a simple average of all sites.
Note I said minimal and not no human induced changes. The fact is I can't see and estimate the effects of all human changes to a particular area. I have just eliminated the obvious changes. Make no mistake, humans do create localized changes in temperature. It is widely recognized developed areas typically have higher average temperatures than surrounding, lesser or undeveloped areas.
Every location in Australia will follow this general trend within factors of variability caused by localized affects, most of which are probably human induced. The strength of this assertion is it is absolutely true for all seven of the site records not included in the average. All of them follow this general trend to some degree or for some period of time.
Until the next time......


No comments:
Post a Comment